Note
Go to the end to download the full example code
6. Prediction Analysis
import numpy as np
import pandas as pd
import matplotlib.pyplot as plt
plt.rcParams["font.family"] = "Times New Roman"

from utils import get_dataset
from utils import evaluate_model
from utils import get_fitted_model
from utils import prediction_distribution
dataset ,  _, _ = get_dataset(encoding="ohe")
X_train, y_train = dataset.training_data()
X_test, y_test = dataset.test_data()
***** Training *****
input_x shape:  (1059, 74)
target shape:  (1059, 1)
***** Test *****
input_x shape:  (455, 74)
target shape:  (455, 1)
model, _ = get_fitted_model()
***** Training *****
input_x shape:  (1059, 74)
target shape:  (1059, 1)
dot plot of model could not be plotted due to ('You must install pydot (`pip install pydot`) and install graphviz (see instructions at https://graphviz.gitlab.io/download/) ', 'for plot_model/model_to_dot to work.')
test_p = model.predict(x=X_test)
assigning name input_1 to IteratorGetNext:0 with shape (None, 74)
#evaluate_model(y_test, test_p)
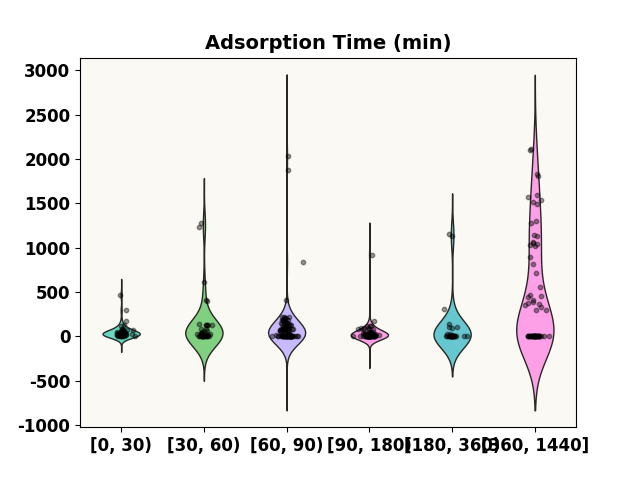
Prediction Distribution
prediction_distribution('Adsorption Time (min)', test_p, 0.4 )
***** Test *****
input_x shape:  (455, 74)
target shape:  (455, 1)

A value is trying to be set on a copy of a slice from a DataFrame.
Try using .loc[row_indexer,col_indexer] = value instead

See the caveats in the documentation: https://pandas.pydata.org/pandas-docs/stable/user_guide/indexing.html#returning-a-view-versus-a-copy
FixedFormatter should only be used together with FixedLocator

<AxesSubplot:title={'center':'Adsorption Time (min)'}>
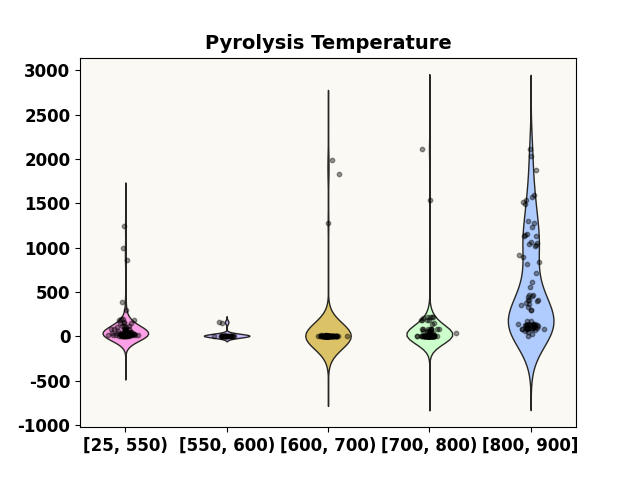
grid = [25, 550, 600, 700, 800, 900]
prediction_distribution('Pyrolysis Temperature', test_p, 0.4, grid=grid)
***** Test *****
input_x shape:  (455, 74)
target shape:  (455, 1)

A value is trying to be set on a copy of a slice from a DataFrame.
Try using .loc[row_indexer,col_indexer] = value instead

See the caveats in the documentation: https://pandas.pydata.org/pandas-docs/stable/user_guide/indexing.html#returning-a-view-versus-a-copy
FixedFormatter should only be used together with FixedLocator

<AxesSubplot:title={'center':'Pyrolysis Temperature'}>
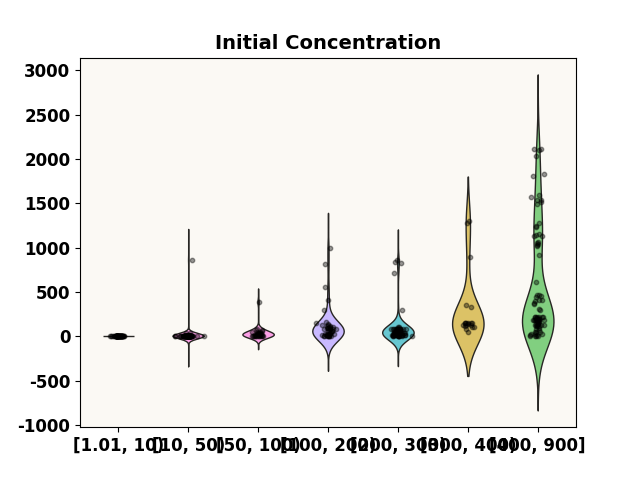
grid = [1.01, 10, 50, 100, 200, 300, 400, 900]
prediction_distribution('Initial Concentration', test_p, 0.4, grid=grid)
***** Test *****
input_x shape:  (455, 74)
target shape:  (455, 1)

A value is trying to be set on a copy of a slice from a DataFrame.
Try using .loc[row_indexer,col_indexer] = value instead

See the caveats in the documentation: https://pandas.pydata.org/pandas-docs/stable/user_guide/indexing.html#returning-a-view-versus-a-copy
FixedFormatter should only be used together with FixedLocator

<AxesSubplot:title={'center':'Initial Concentration'}>
prediction_distribution('Solution pH', test_p, 0.4)

***** Test *****
input_x shape:  (455, 74)
target shape:  (455, 1)

A value is trying to be set on a copy of a slice from a DataFrame.
Try using .loc[row_indexer,col_indexer] = value instead

See the caveats in the documentation: https://pandas.pydata.org/pandas-docs/stable/user_guide/indexing.html#returning-a-view-versus-a-copy
FixedFormatter should only be used together with FixedLocator

<AxesSubplot:title={'center':'Solution pH'}>
grid = [0.0, 0.01, 0.04, 0.1, 0.5, 2.47, 10]
prediction_distribution('Adsorbent Loading', test_p, 0.4, grid)

***** Test *****
input_x shape:  (455, 74)
target shape:  (455, 1)

A value is trying to be set on a copy of a slice from a DataFrame.
Try using .loc[row_indexer,col_indexer] = value instead

See the caveats in the documentation: https://pandas.pydata.org/pandas-docs/stable/user_guide/indexing.html#returning-a-view-versus-a-copy
FixedFormatter should only be used together with FixedLocator

<AxesSubplot:title={'center':'Adsorbent Loading'}>
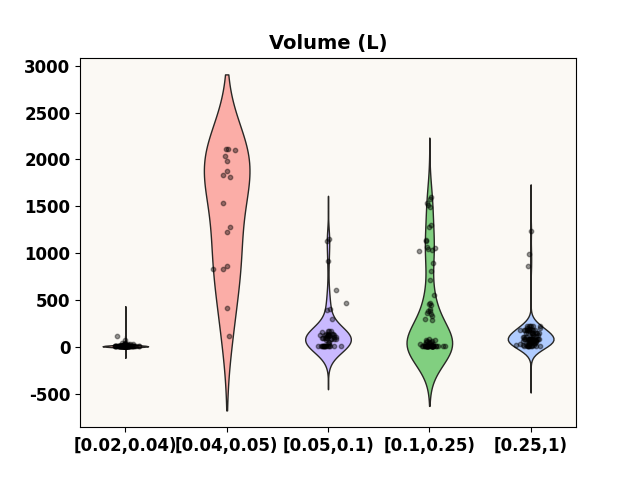
prediction_distribution('Volume (L)', test_p, 0.4)
***** Test *****
input_x shape:  (455, 74)
target shape:  (455, 1)

A value is trying to be set on a copy of a slice from a DataFrame.
Try using .loc[row_indexer,col_indexer] = value instead

See the caveats in the documentation: https://pandas.pydata.org/pandas-docs/stable/user_guide/indexing.html#returning-a-view-versus-a-copy
FixedFormatter should only be used together with FixedLocator

<AxesSubplot:title={'center':'Volume (L)'}>
prediction_distribution('Adsorption Temperature', test_p, 0.4)

***** Test *****
input_x shape:  (455, 74)
target shape:  (455, 1)

A value is trying to be set on a copy of a slice from a DataFrame.
Try using .loc[row_indexer,col_indexer] = value instead

See the caveats in the documentation: https://pandas.pydata.org/pandas-docs/stable/user_guide/indexing.html#returning-a-view-versus-a-copy
FixedFormatter should only be used together with FixedLocator

<AxesSubplot:title={'center':'Adsorption Temperature'}>
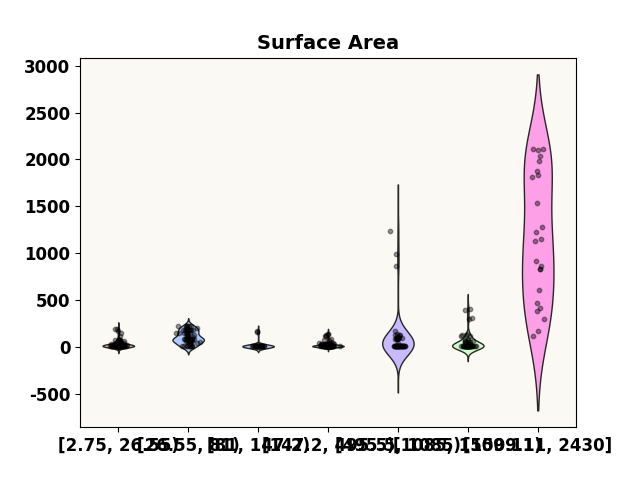
grid = [2.75, 26.55, 81, 147.2, 495.5, 1085, 1509.11, 2430]
prediction_distribution('Surface Area', test_p, 0.4, grid=grid)
***** Test *****
input_x shape:  (455, 74)
target shape:  (455, 1)

A value is trying to be set on a copy of a slice from a DataFrame.
Try using .loc[row_indexer,col_indexer] = value instead

See the caveats in the documentation: https://pandas.pydata.org/pandas-docs/stable/user_guide/indexing.html#returning-a-view-versus-a-copy
FixedFormatter should only be used together with FixedLocator

<AxesSubplot:title={'center':'Surface Area'}>
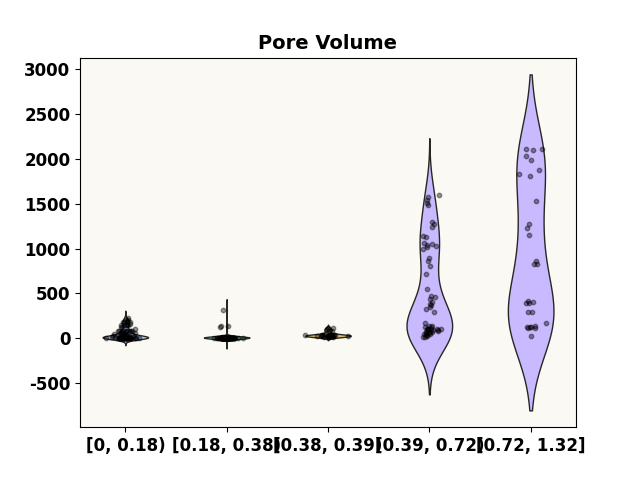
grid = [0.0, 0.18, 0.38, 0.39, 0.72, 1.32]
prediction_distribution('Pore Volume', test_p, 0.4, grid=grid)
***** Test *****
input_x shape:  (455, 74)
target shape:  (455, 1)

A value is trying to be set on a copy of a slice from a DataFrame.
Try using .loc[row_indexer,col_indexer] = value instead

See the caveats in the documentation: https://pandas.pydata.org/pandas-docs/stable/user_guide/indexing.html#returning-a-view-versus-a-copy
FixedFormatter should only be used together with FixedLocator

<AxesSubplot:title={'center':'Pore Volume'}>
Feature Interaction
_ = model.prediction_analysis(
    x = pd.DataFrame(X_test, columns=dataset.input_features),
    features = ['Adsorption Time (min)', 'Pyrolysis Time (min)'],
    feature_names = ['Adsorption Time (min)', 'Pyrolysis Time (min)'],
    grid_types=["percentile", "percentile"],
    num_grid_points=[6, 6],
    border=True,
    annotate_kws={'annotate_fontsize':15,
                  'annotate_colors': np.array(
                      [['black', 'black', 'black', 'black'],
                      ['black', 'black', 'black', 'black'],
                      ['black', 'white', 'black', 'black'],
                      ['black', 'black', 'black', 'black']])}
    )

_ = model.prediction_analysis(
    x = pd.DataFrame(X_test, columns=dataset.input_features),
    features = ['Adsorption Time (min)', 'Initial Concentration'],
    feature_names = ['Adsorption Time (min)', 'Initial Concentration'],
    grid_types=["percentile", "percentile"],
    num_grid_points=[6, 6],
    border=True,
    annotate_kws={'annotate_fontsize': 15,
                  'annotate_colors': np.array(
                      [['black', 'black', 'black', 'black', 'black'],
                       ['black', 'black', 'black', 'black', 'black'],
                       ['black', 'black', 'black', 'black', 'black'],
                       ['white', 'black', 'black', 'black', 'black']])}
)

_ = model.prediction_analysis(
    x = pd.DataFrame(X_test, columns=dataset.input_features),
    features = ['Adsorption Time (min)', 'Solution pH'],
    feature_names = ['Adsorption Time (min)', 'Solution pH'],
    grid_types=["percentile", "percentile"],
    num_grid_points=[6, 6],
    border=True,
    annotate_kws={'annotate_fontsize': 15,
                  'annotate_colors': np.array(
                      [['black', 'white', 'black', 'black'],
                       ['black', 'white', 'black', 'black'],
                       ['black', 'white', 'black', 'black'],
                       ['black', 'black', 'black', 'black']])}
)

_ = model.prediction_analysis(
    x = pd.DataFrame(X_test, columns=dataset.input_features),
    features = ['Adsorption Time (min)', 'Adsorbent Loading'],
    feature_names = ['Adsorption Time (min)', 'Adsorbent Loading'],
    grid_types=["percentile", "percentile"],
    num_grid_points=[6, 6],
    border=True,
    annotate_kws={'annotate_fontsize': 15,
                  'annotate_colors': np.array(
                      [['black', 'black', 'black', 'black', 'black'],
                       ['black', 'black', 'black', 'black', 'black'],
                       ['black', 'white', 'black', 'black', 'black'],
                       ['black', 'black', 'black', 'black', 'black']])
                                 }
)

Total running time of the script: (0 minutes 13.731 seconds)