Note
Go to the end to download the full example code
1. EDA
import matplotlib.pyplot as plt
plt.rcParams["font.family"] = "Times New Roman"

import pandas as pd

from ai4water.eda import EDA
from easy_mpl import plot, boxplot, hist
from easy_mpl.utils import create_subplots

from utils import make_data, box_violin, \
    DYE_TYPES, ADSORBENT_TYPES
/home/docs/checkouts/readthedocs.org/user_builds/ai4adsorption/envs/latest/lib/python3.7/site-packages/sklearn/experimental/enable_hist_gradient_boosting.py:17: UserWarning: Since version 1.0, it is not needed to import enable_hist_gradient_boosting anymore. HistGradientBoostingClassifier and HistGradientBoostingRegressor are now stable and can be normally imported from sklearn.ensemble.
  "Since version 1.0, "
IPython could not be loaded!
Loading the original dataset
data, _, _ = make_data()
Here, we are printing the shape of original dataset. The first value shows the number of samples/examples/datapoints and the second one shows the number of features.
print(data.shape)
(1514, 13)
The first five samples are
data.head()
The last five samples are
data.tail()
The names of different adsorbents and their counts
data['Adsorbent'].value_counts()
Exfoliated GIC    213
GIC               141
MN-Biochar        114
M-Biochar         114
MZ-Biochar        114
PSB-LDHMgAl        99
APAC               98
PSB                93
CMCAC              72
TSAC               46
SAC                34
WSAC               32
CAC                26
CBAC               26
HAC                26
MC550              24
AC800              21
AC600              21
AC700              21
AC900              21
CS                 13
BGBHAC             10
CS-AC-H4P2O7        9
CS-AC-H3PO4         9
CS-AC-NaOH          9
CS-AC-KOH           9
TWAC                7
VAC                 6
MCNaOH40            5
MCNaOH50            5
MC30/1              5
MCNaOH30            5
MC0.478             5
MC0.75              5
MC0.659             5
MC0.569             5
MC20/1              5
MC25/1              5
MC35/1              5
MCNaOH10            5
MC600               4
MC500               4
MC450               4
MC400               4
MC350               4
TRAC                4
GSAC-Ce-1           1
GSAC                1
Name: Adsorbent, dtype: int64
The names of different dyes and their counts
data['Dye'].value_counts()
CR        378
MB        326
MO        269
FG FCF    171
NR        104
SYF        99
GR         36
Rhd B      32
MV         24
AR         24
RB5        22
YD          9
AM          7
BV14        7
RD          4
AB25        2
Name: Dye, dtype: int64
Removing the categorical features from our dataframe
data.pop("Adsorbent")
data.pop("Dye")
0           CR
1           CR
2           CR
3           CR
4           CR
         ...
1509    FG FCF
1510    FG FCF
1511    FG FCF
1512    FG FCF
1513    FG FCF
Name: Dye, Length: 1514, dtype: object
get statistical summary of data
pd.set_option('display.max_columns', None)

print(data.describe())
       Adsorption Time (min)  Pyrolysis Temperature  Pyrolysis Time (min)  \
count            1514.000000            1514.000000           1514.000000
mean              171.938573             575.769485            119.175028
std               269.035920             260.147498            136.463100
min                 0.000000              25.000000              0.000000
25%                60.000000             550.000000              0.333300
50%                60.000000             700.000000             60.000000
75%               150.000000             700.000000            120.000000
max              1440.000000             900.000000            360.000000

       Initial Concentration  Solution pH  Adsorbent Loading   Volume (L)  \
count            1514.000000  1514.000000        1514.000000  1514.000000
mean              164.771493     5.976427           0.931035     0.152318
std               188.311013     1.758724           2.296184     0.229913
min                 1.005333     2.800000           0.001000     0.020000
25%                10.000000     5.150000           0.037500     0.025000
50%               100.000000     7.000000           0.050000     0.050000
75%               300.000000     7.000000           0.500000     0.250000
max               900.000000    11.670000          10.000000     1.000000

       Adsorption Temperature  Surface Area  Pore Volume   Adsorption
count             1514.000000   1514.000000  1514.000000  1514.000000
mean                25.772787    537.959901     0.237928   180.774681
std                  4.827209    697.224000     0.297145   419.203955
min                 15.000000      2.750000     0.000100     0.000000
25%                 25.000000     26.550000     0.016000     4.952459
50%                 25.000000    181.100000     0.183000    20.000000
75%                 25.000000    893.000000     0.389000    98.487500
max                 60.000000   2430.000000     1.321000  2235.000000
initializing an instance of EDA class from AI4Water in order to get some insights of the data
eda = EDA(data = data, save=False, show=False)
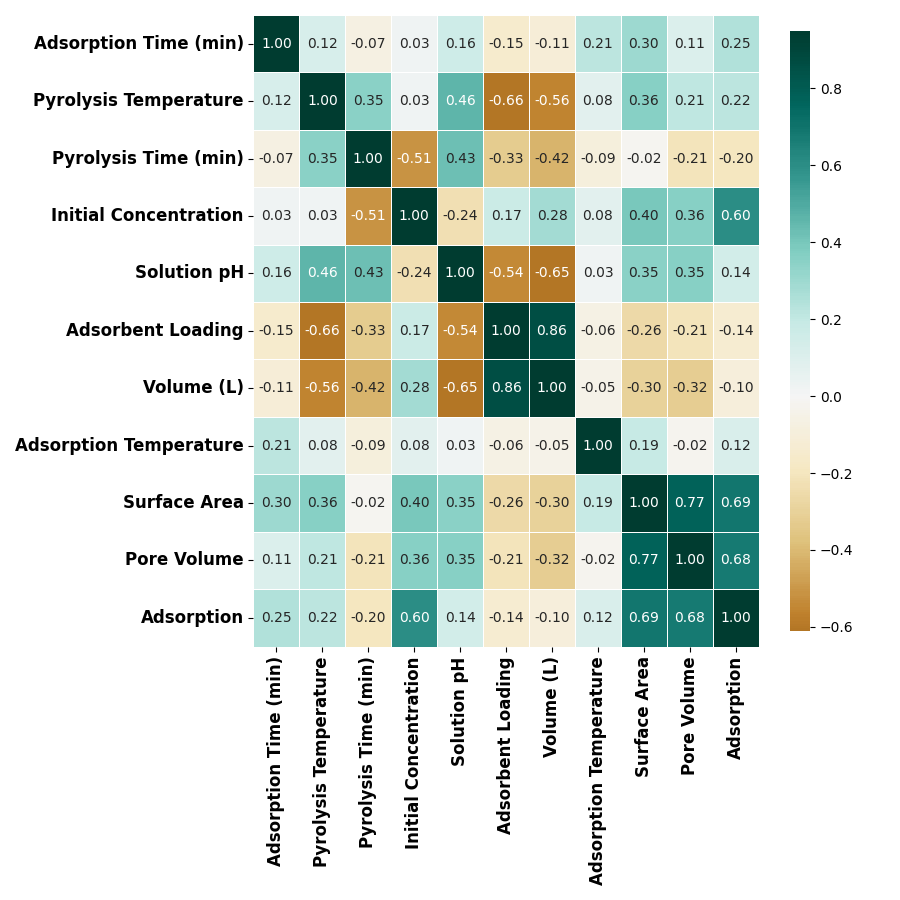
plot correlation between numerical features
ax = eda.correlation(figsize=(9,9))
ax.set_xticklabels(ax.get_xticklabels(), fontsize=12, weight='bold')
ax.set_yticklabels(ax.get_yticklabels(), fontsize=12, weight='bold')
plt.tight_layout()
plt.show()
findfont: Font family ['Times New Roman'] not found. Falling back to DejaVu Sans.
findfont: Font family ['Times New Roman'] not found. Falling back to DejaVu Sans.
findfont: Font family ['Times New Roman'] not found. Falling back to DejaVu Sans.
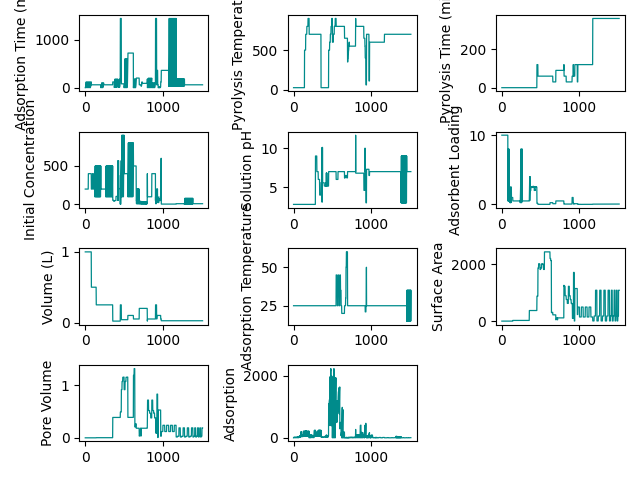
making a line plot for numerical features
fig, axes = create_subplots(data.shape[1])

for ax, col, label  in zip(axes.flat, data, data.columns):

    plot(data[col].values, ax=ax, ax_kws=dict(ylabel=col),
         lw=0.9,
         color='darkcyan', show=False)
plt.tight_layout()
plt.show()
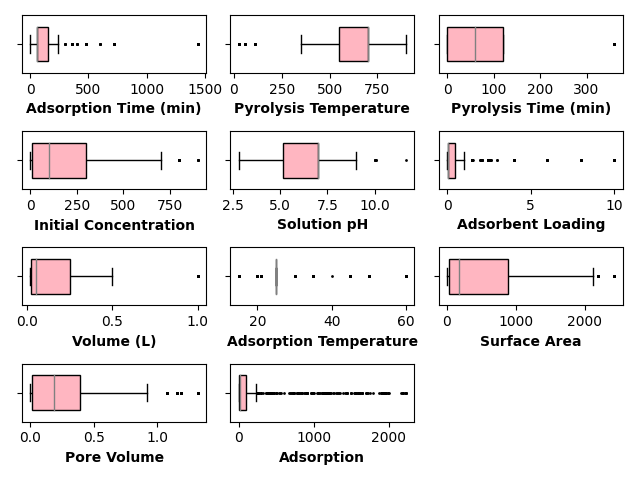
fig, axes = create_subplots(data.shape[1])
for ax, col in zip(axes.flat, data.columns):
    boxplot(data[col].values, ax=ax, vert=False, fill_color='lightpink',
            flierprops={"ms": 1.0}, show=False, patch_artist=True,
            widths=0.6, medianprops={"color": "gray"},
            ax_kws=dict(xlabel=col, xlabel_kws={'weight': "bold"}))
plt.tight_layout()
plt.show()
findfont: Font family ['Times New Roman'] not found. Falling back to DejaVu Sans.
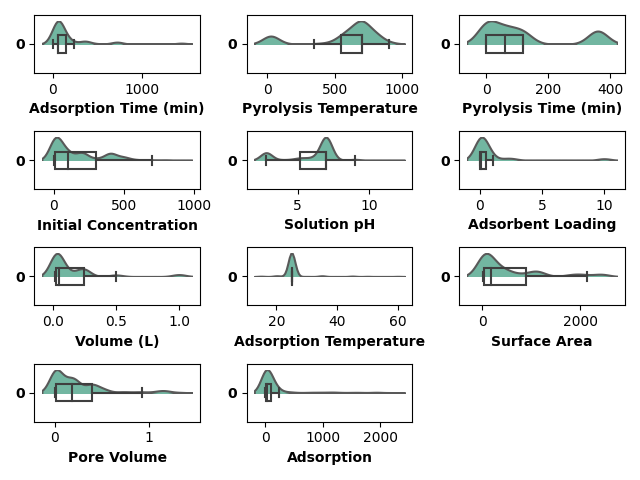
show the box and (half) violin plots together
fig, axes = create_subplots(data.shape[1])
for ax, col in zip(axes.flat, data.columns):
    box_violin(ax=ax, data=data[col], palette="Set2")
    ax.set_xlabel(xlabel=col, weight='bold')
    ax.set_yticklabels(ax.get_yticklabels(), weight='bold')
plt.tight_layout()
plt.show()
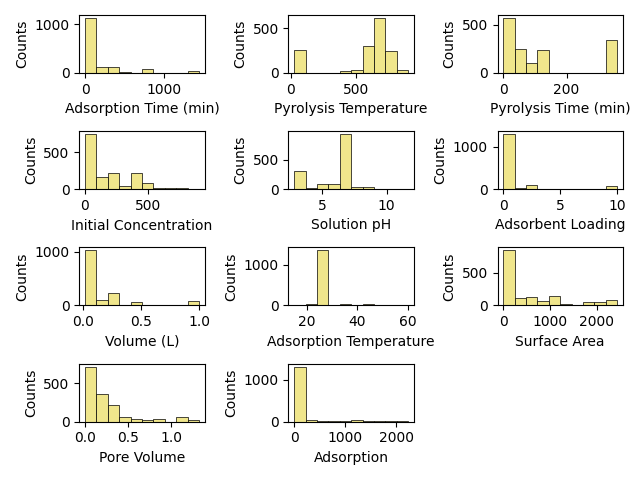
fig, axes = create_subplots(data.shape[1])

for ax, col, label  in zip(axes.flat, data, data.columns):

    hist(data[col].values, ax=ax, bins=10,  show=False,
         grid=False,linewidth=0.5, edgecolor="k", color="khaki",
         ax_kws=dict(ylabel="Counts", xlabel=col))
plt.tight_layout()
plt.show()
data, _, _ = make_data()
data.pop('Dye')
feature = data['Adsorbent']
d = {k:ADSORBENT_TYPES[k] for k in feature.unique()}
feature = feature.map(d)
data['Adsorbent'] = feature

df_gb = data.loc[data['Adsorbent']=="GB"]
df_ac = data.loc[data['Adsorbent']=="AC"]
df_bio = data.loc[data['Adsorbent']=="Biochar"]
data.pop('Adsorbent')

fig, axes = create_subplots(data.shape[1])

for ax, col in zip(axes.flat, data.columns):

    boxplot([df_gb[col], df_ac[col], df_bio[col]],
            labels=["GB", "AC", "BC"],
                ax=ax,
                flierprops={"ms": 0.6},
                fill_color='lightpink',
                patch_artist=True,
                widths=0.5,
            medianprops={"color": "gray"},
            vert=False,
            show=False,
            ax_kws=dict(xlabel=col, xlabel_kws={'weight': 'bold'})
                )
    ax.set_yticklabels(ax.get_yticklabels(), weight='bold')
plt.tight_layout()
plt.show()

data, _, _ = make_data()
data.pop('Adsorbent')
feature = data['Dye']
d = {k:DYE_TYPES[k] for k in feature.unique()}
feature = feature.map(d)
data['Dye'] = feature
df_an = data.loc[data['Dye']=="Anionic"]
df_cat = data.loc[data['Dye']=="Cationic"]
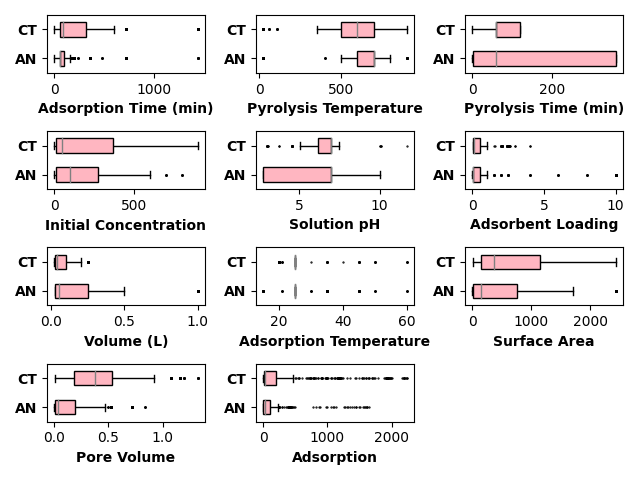
data.pop('Dye')
fig, axes = create_subplots(data.shape[1])
for ax, col in zip(axes.flat, data.columns):
boxplot([df_an[col], df_cat[col]],
labels=["AN", "CT"],
ax=ax,
flierprops={"ms": 0.6},
medianprops={"color": "gray"},
fill_color='lightpink',
patch_artist=True,
vert=False,
widths=0.5,
show=False,
ax_kws=dict(xlabel=col, xlabel_kws={"weight": "bold"})
)
ax.set_yticklabels(ax.get_yticklabels(), weight='bold')
plt.tight_layout()
plt.show()
data, _, _ = make_data()
feature = data['Adsorbent']
d = {k:ADSORBENT_TYPES[k] for k in feature.unique()}
feature = feature.map(d)
data['Adsorbent'] = feature

df_ac = data.loc[data['Adsorbent']=="AC"]
df_ac['code'] = "AC"
df_bc = data.loc[data['Adsorbent']=="Biochar"]
df_bc['code'] = "BC"
df_gb = data.loc[data['Adsorbent']=="GB"]
df_gb['code'] = "GB"


df_ac.describe()
A value is trying to be set on a copy of a slice from a DataFrame.
Try using .loc[row_indexer,col_indexer] = value instead

See the caveats in the documentation: https://pandas.pydata.org/pandas-docs/stable/user_guide/indexing.html#returning-a-view-versus-a-copy

A value is trying to be set on a copy of a slice from a DataFrame.
Try using .loc[row_indexer,col_indexer] = value instead

See the caveats in the documentation: https://pandas.pydata.org/pandas-docs/stable/user_guide/indexing.html#returning-a-view-versus-a-copy

A value is trying to be set on a copy of a slice from a DataFrame.
Try using .loc[row_indexer,col_indexer] = value instead

See the caveats in the documentation: https://pandas.pydata.org/pandas-docs/stable/user_guide/indexing.html#returning-a-view-versus-a-copy
df_ac.median()
Dropping of nuisance columns in DataFrame reductions (with 'numeric_only=None') is deprecated; in a future version this will raise TypeError.  Select only valid columns before calling the reduction.

Adsorption Time (min)      90.000000
Pyrolysis Temperature     650.000000
Pyrolysis Time (min)       60.000000
Initial Concentration     104.677713
Solution pH                 7.000000
Adsorbent Loading           0.100000
Volume (L)                  0.050000
Adsorption Temperature     25.000000
Surface Area              623.000000
Pore Volume                 0.389000
Adsorption                 73.123885
dtype: float64
df_bc.describe()
df_bc.median()
Dropping of nuisance columns in DataFrame reductions (with 'numeric_only=None') is deprecated; in a future version this will raise TypeError.  Select only valid columns before calling the reduction.

Adsorption Time (min)      60.000000
Pyrolysis Temperature     700.000000
Pyrolysis Time (min)      360.000000
Initial Concentration      10.000000
Solution pH                 7.000000
Adsorbent Loading           0.037500
Volume (L)                  0.025000
Adsorption Temperature     25.000000
Surface Area              181.100000
Pore Volume                 0.120000
Adsorption                  1.322144
dtype: float64
df_gb.describe()
df_gb.median()
Dropping of nuisance columns in DataFrame reductions (with 'numeric_only=None') is deprecated; in a future version this will raise TypeError.  Select only valid columns before calling the reduction.

Adsorption Time (min)      60.000000
Pyrolysis Temperature     700.000000
Pyrolysis Time (min)        0.333300
Initial Concentration     200.000000
Solution pH                 2.800000
Adsorbent Loading           0.500000
Volume (L)                  0.250000
Adsorption Temperature     25.000000
Surface Area               26.550000
Pore Volume                 0.002500
Adsorption                 63.866667
dtype: float64
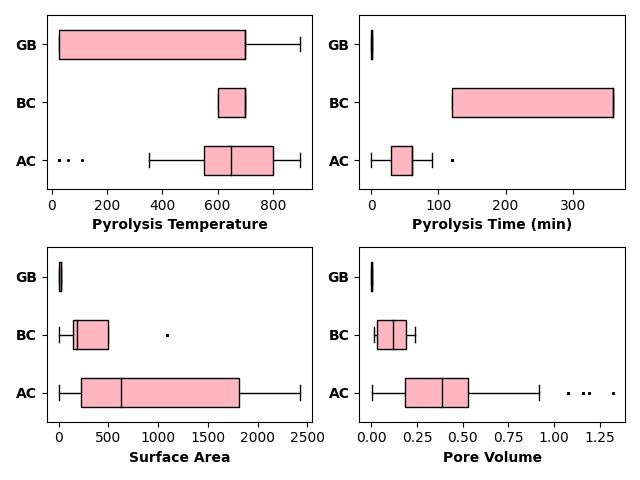
COLUMNS = ['Pyrolysis Temperature', 'Pyrolysis Time (min)', 'Surface Area', 'Pore Volume']

fig, axes = create_subplots(len(COLUMNS))

for ax, col in zip(axes.flat, COLUMNS):
    df_ads_feat = pd.concat([df_ac[[col, 'code']],
                             df_bc[[col, 'code']],
                             df_gb[[col, 'code']]])

    boxplot([df_ac[col], df_bc[col], df_gb[col]],
            labels=["AC", "BC", "GB"],
            ax=ax,
            flierprops={"ms": 0.6},
            medianprops={"color": "black"},
            fill_color='lightpink',
            patch_artist=True,
            vert=False,
            widths=0.5,
            show=False,
            ax_kws=dict(xlabel=col, xlabel_kws={"weight": "bold"})
                )
    ax.set_yticklabels(ax.get_yticklabels(), weight='bold')
plt.tight_layout()
plt.show()
Total running time of the script: (0 minutes 15.233 seconds)